How to Read Traceroute Results
Interpret traceroute output columns including hop number, round-trip time, IP address, asterisk timeouts, and ICMP error codes on Linux, macOS, and Windows.
- Prerequisites
- Step-by-Step: Read Traceroute Output
- 1. Run traceroute against the target host
- 2. Identify the output columns
- 3. Interpret asterisk timeouts in traceroute output
- 4. Detect latency spikes in traceroute results
- 5. Recognize ICMP error codes in traceroute output
- How to Verify Traceroute Results
- Common Issues When Reading Traceroute Output
Read and interpret traceroute output to identify each hop along the network path, measure round-trip latency, and detect packet loss or firewall filtering.
Prerequisites
- A terminal or command prompt with traceroute (Linux/macOS) or tracert (Windows) available.
- Network connectivity to the target host.
Step-by-Step: Read Traceroute Output
1. Run traceroute against the target host
Run traceroute on Linux or macOS by passing the destination hostname or IP address. On Windows, use the
tracert command instead:
Linux / macOS:
traceroute example.comWindows:
tracert example.comTraceroute begins sending probe packets with incrementing Time to Live (TTL) values and displays one line of output per hop.
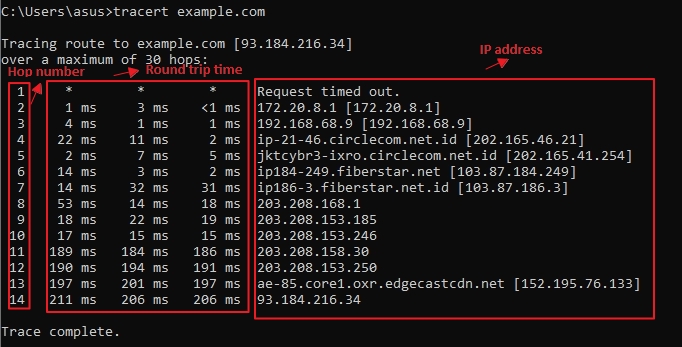
2. Identify the output columns
Traceroute output contains five columns per hop. Each line represents one router along the network path between the source and the destination:
- Column 1 — Hop number.Traceroute assigns a sequential number to each router, starting at 1 for the first gateway.
- Columns 2, 3, 4 — Round-trip time (RTT).Traceroute sends three probes per hop by default. Each column shows the round-trip time in milliseconds for one probe. Comparing the three values reveals latency consistency at that hop.
- Column 5 — IP address or hostname.Traceroute displays the IP address of the router that responded. If DNS resolution is enabled (default), traceroute also shows the hostname.
3. Interpret asterisk timeouts in traceroute output
Traceroute prints an asterisk (
*) when a probe receives no response within the timeout period (default: 5 seconds). A single asterisk among valid round-trip times indicates intermittent packet loss or rate-limited ICMP responses at that hop.
Three consecutive asterisks (
* * *) on a hop line mean the router did not respond to any of the three probes. This pattern occurs when a firewall or router access control list (ACL) drops ICMP Time Exceeded messages. The router still forwards traffic — it does not respond to traceroute probes.
Multiple consecutive hops showing
* * * suggest a firewall-protected network segment. Traceroute continues probing beyond non-responsive hops until it reaches the destination or the maximum hop count.
4. Detect latency spikes in traceroute results
Traceroute reveals latency issues when the round-trip time increases at a specific hop and remains elevated for all subsequent hops. A sustained increase from hop N onward indicates congestion or a slow link at hop N.
A single hop with high round-trip times that returns to normal at the next hop does not indicate a network problem. Routers prioritize forwarding traffic over responding to ICMP messages. The elevated time reflects the router's ICMP processing delay, not actual path latency.
5. Recognize ICMP error codes in traceroute output
Traceroute displays error codes when a router returns an ICMP Destination Unreachable message instead of an ICMP Time Exceeded response. Common traceroute error codes include:
!N— Network unreachable. No route exists to the destination network.!H— Host unreachable. The target host cannot be reached on the destination network.!A— Administratively prohibited. A firewall or ACL blocks the probe.!P— Protocol unreachable. The destination does not support the probe's transport protocol.
For detailed troubleshooting of each error code, see the Traceroute Troubleshootingindex.
How to Verify Traceroute Results
Run traceroute to the same destination multiple times to confirm the results. Internet Protocol (IP) routing does not guarantee that packets follow the same path — load balancers and dynamic routing protocols can shift traffic between paths. Consistent results across multiple runs confirm a stable route.
Compare traceroute results with a ping test to the same destination. Traceroute shows the path and per-hop latency. The
ping command measures end-to-end round-trip time and packet loss. If ping shows no packet loss but traceroute shows asterisks at intermediate hops, those routers filter ICMP probes without affecting actual traffic.
Common Issues When Reading Traceroute Output
All hops show asterisks (
* * *).Traceroute produces all-asterisk output when the local firewall blocks outgoing UDP or ICMP probes. On Linux, try ICMP mode with
sudo traceroute -I example.com or TCP mode with
sudo traceroute -T example.com. On Windows, verify that Windows Defender Firewall allows outbound ICMP Echo Requests.
Traceroute never reaches the destination.Traceroute stops at the maximum hop count (default: 30) without reaching the target when the destination is more than 30 hops away or when a firewall drops all probes before they reach the target. Increase the maximum hop count with
traceroute -m 60 example.com on Linux/macOS or
tracert -h 60 example.com on Windows.
Hostnames appear as IP addresses.Traceroute skips hostname resolution when the
-n flag is active or when reverse DNS records (PTR records) do not exist for the router's IP address. Many ISP and backbone routers lack PTR records.